Overview
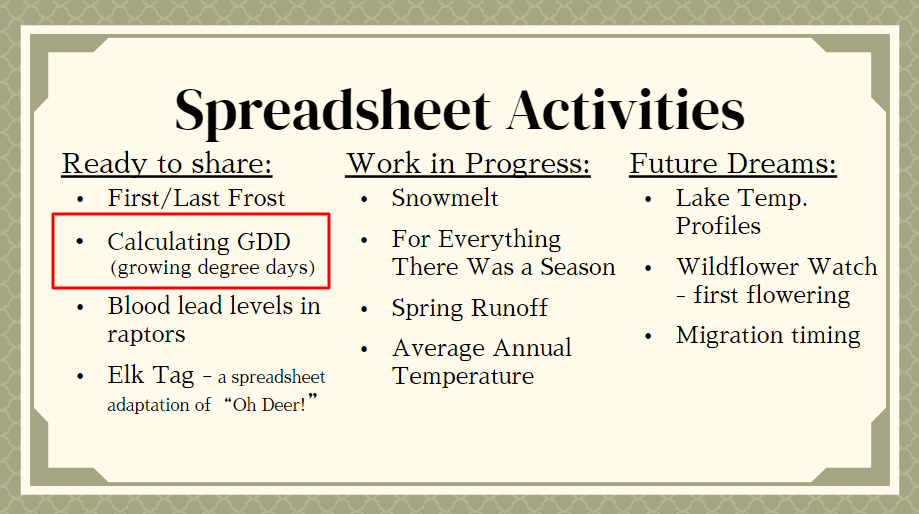
Johnson Whippie, a high school science teacher, developed a series of spreadsheet-based classroom tools to help students engage with big, messy data. These spreadsheet activities are designed to connect students to place and to improve scientific literacy. The featured spreadsheet activity focuses on calculating growing degree days (GDD), which allows students to track temperature patterns over time and use those patterns to understand seasonal environmental change, including predicting plant and insect development stages.
See how Johnson introduced the need for these spreadsheets HERE. Scroll down to the Resources & Links section of this page to check out this spreadsheet.
Goals
- Build student scientific literacy skills
- Connect classroom learning to Wyoming-specific ecological and agricultural contexts to support place-based learning
- Strengthen student ability to use spreadsheets for data collection and analysis
Implementation & Outcomes
- Implemented with 9th-12th grade Ecology students
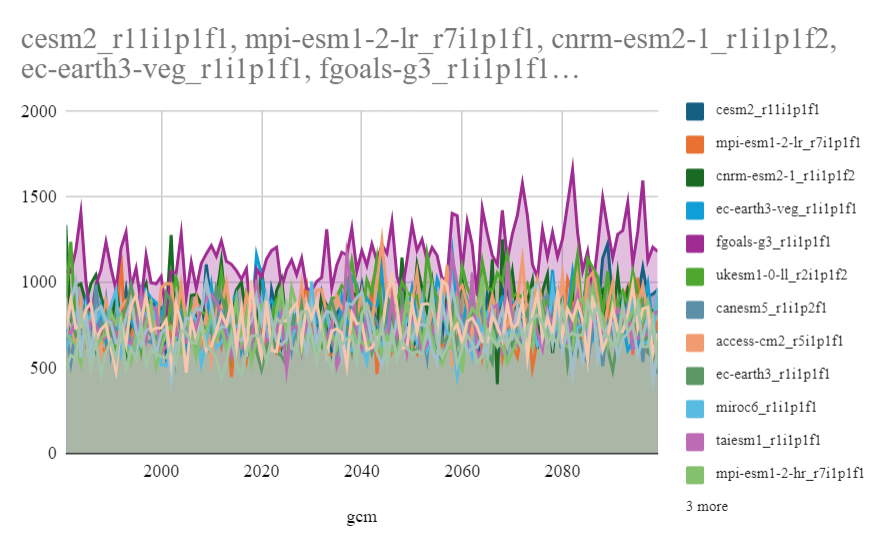
- Using the GDD spreadsheet, students input temperature data, apply formulas to calculate GDD, and generate graphs to visualize GDD
- "How to" videos for the GDD Activity are linked in the spreadsheet and below
- Future spreadsheet activities will include snowmelt, spring runoff, annual average temperature, and more
Resources & Links
- Growing Degree Days Spreadsheet Activity
- Guidance Video on Steps 1-3: Getting Monthly Data from NOWData site
- FULL Length Video on GDD Calculations with Tips
- QUICK Video on GDD Calculations
- Video Showing How to Get Rid of Repetitive Text in Spreadsheet Data
- Check out this post about Johnson's previous work from TRKE Cohort 1
Contact for More Information
For more details about this program or to learn how to incorporate similar activities in your school, please reach out to the TRKE program coordinators at smtcpd@uwyo.edu.