Educators asked for a way to compare climate data from multiple locations, and the WY-Adapt team delivered. This Compare Climate Data tool lets users select two or more points on a map and compare modeled climate variables--such as temperature and precipitation--across historical, current and future time periods. With this visualization tool, users can easily explore how climate conditions differ across the Western United States and parts of Canada and Mexico.
Climate Comparison Tool
Climate Comparison Tool
Explore Climate Patterns Between Different Locations
Tags: WyAdaptConnected DataVisualization AnalyzingAndInterpretingData InTheClassroom
Posted on November 13, 2025
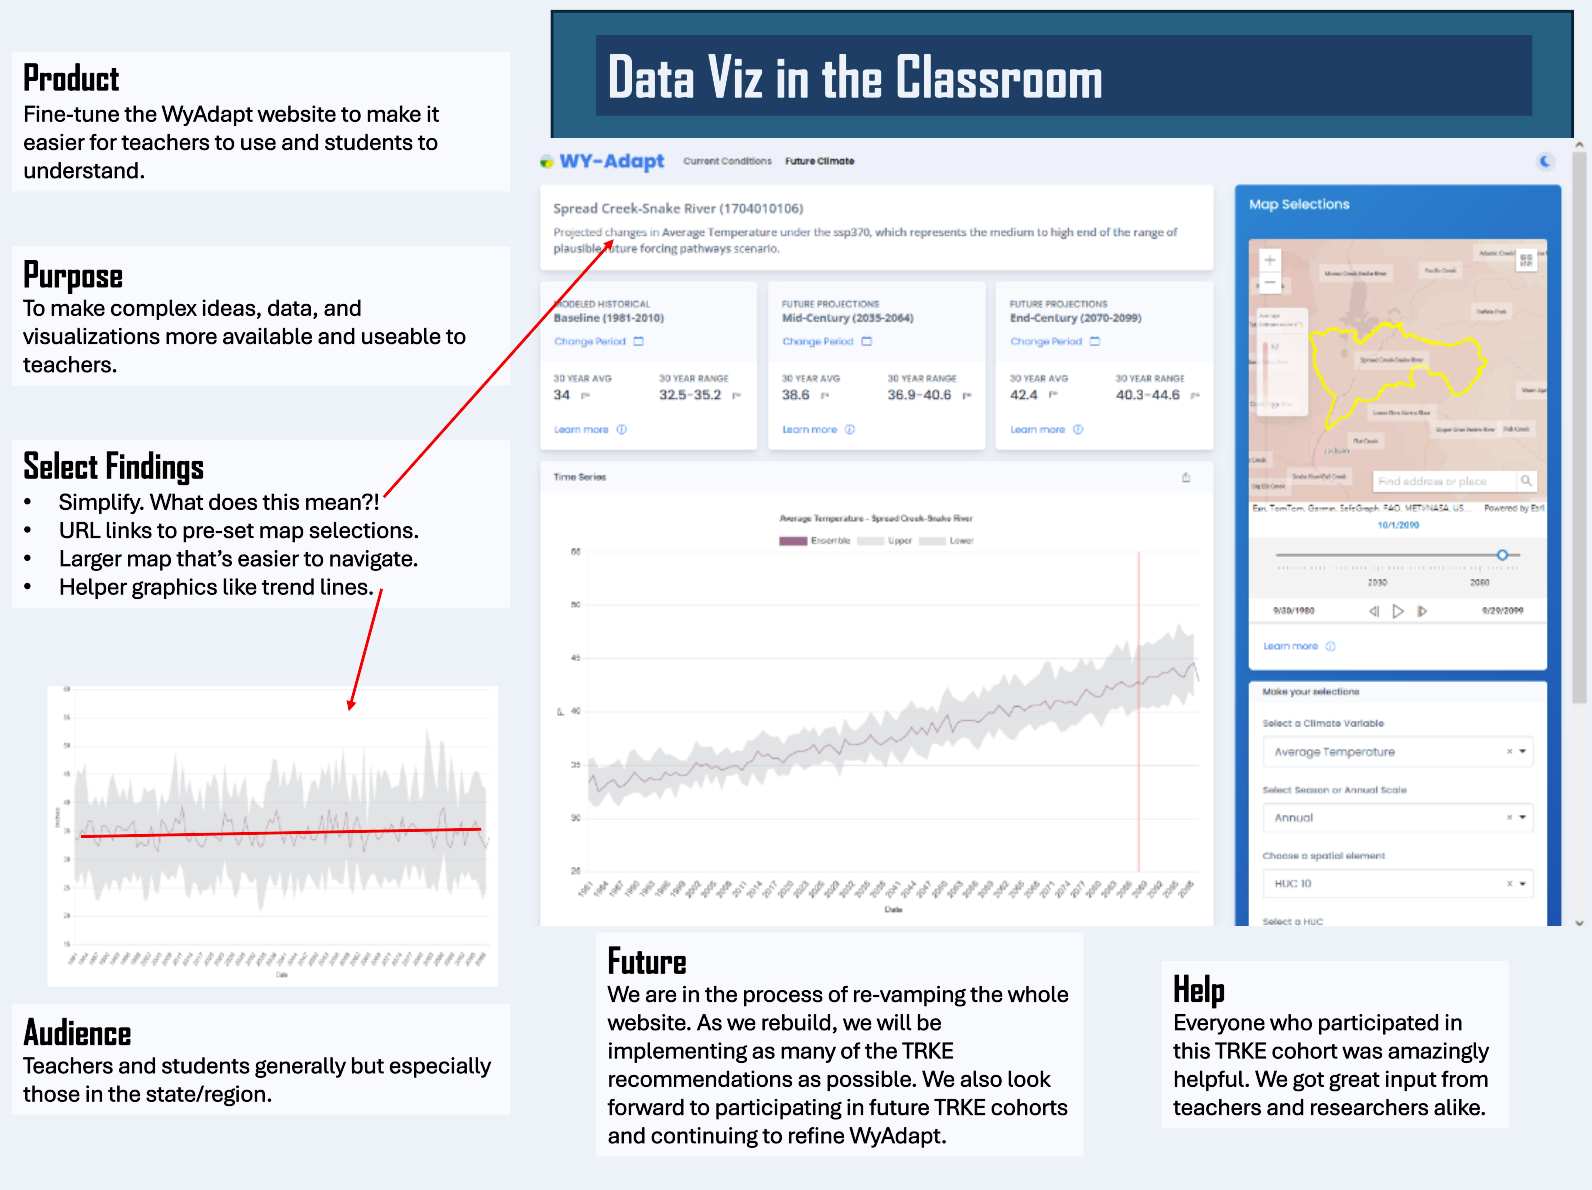
Problem the Tool Solves
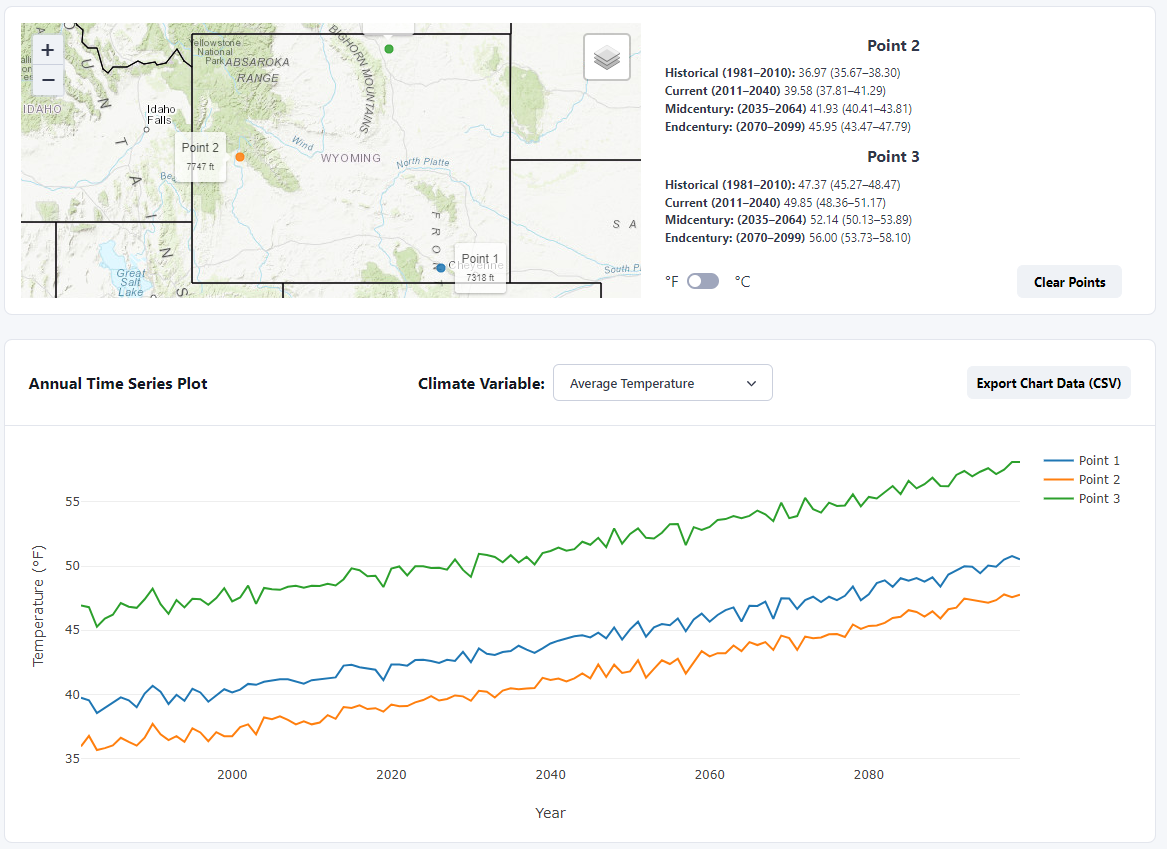
Understanding how climate conditions vary across locations can be challenging when data must be viewed one location at a time. This resource makes it easier to see those differences within a single visualization. At the bottom of the tool, users will also find 30-year modeled annual averages for historical, current, and future time periods for each point selected. Both the visualization and annual averages table can be exported as CSV files.
Who the Tool is For
This tool is designed for educators, students, researchers, and anyone interested in exploring and comparing climate conditions across different locations.
Key Features
- Allows users to select two or more points on a map to compare modeled climate variables
- Displays a selected climate variable (average temperature, precipitation, average max temperature, average min temperature) on a single visualization
- Provides 30-year modeled annual averages for historical, current, and future time periods
- Offers CSV export for both the visualization and the annual averages table
- Covers the Western United States and parts of Canada and Mexico
Application in Classrooms
- Engage students in comparing climate conditions across multiple locations
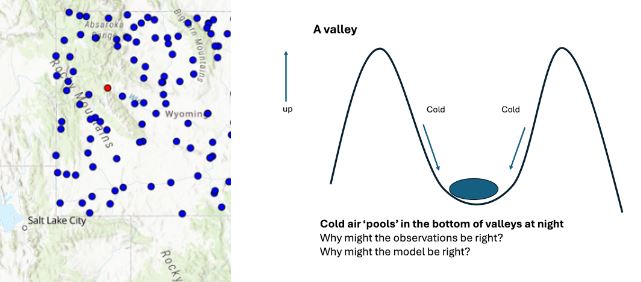
- Support discussions about why different places have different temperature and precipitation trends
- Can be used for analysis and interpretation activities, evidence-based claims, and uncertainty discussions
- Integrate the tool into place-based investigations by having students select locations relevant to their areas of interest