Narratives can serve as a powerful entry point for engaging with complex data by grounding abstract patterns in lived experience, place, and relatable characters. Rather than viewing data as something learners must analyze or explain, narratives invite curiosity, imagination, and sense-making before diving deeper into data.
During our January 20th, 2026 Virtual Session, Dr. Mary Keller helped us explore how narratives can be paired with data to support accessibility, deepen engagement, and create space for uncertainty. The goal was not to replace data analysis with storytelling, but to demonstrate how narrative can act as a bridge to help learners connect their lived experiences with data while still engaging with scientific ideas and evidence.
To illustrate how narrative was used to support sense-making with data, this post is organized around the same sequence used in the virtual session:
- We elicited participants’ experiences and ideas by inviting them to think about their own experiences this winter, and how they may be similar or different from past years.
- Following participant brainstorming, Mary provided context for how narratives can function as learning and sharing tools along with key elements of effective narratives, which were discussed by participants.
- In the “Modeling with Data” section of the post, Mary provides a narrative example told from the perspective of two dogs who use data to figure out where to meet up for some skijoring.
- Participants then worked in small groups to craft their own narratives with data.
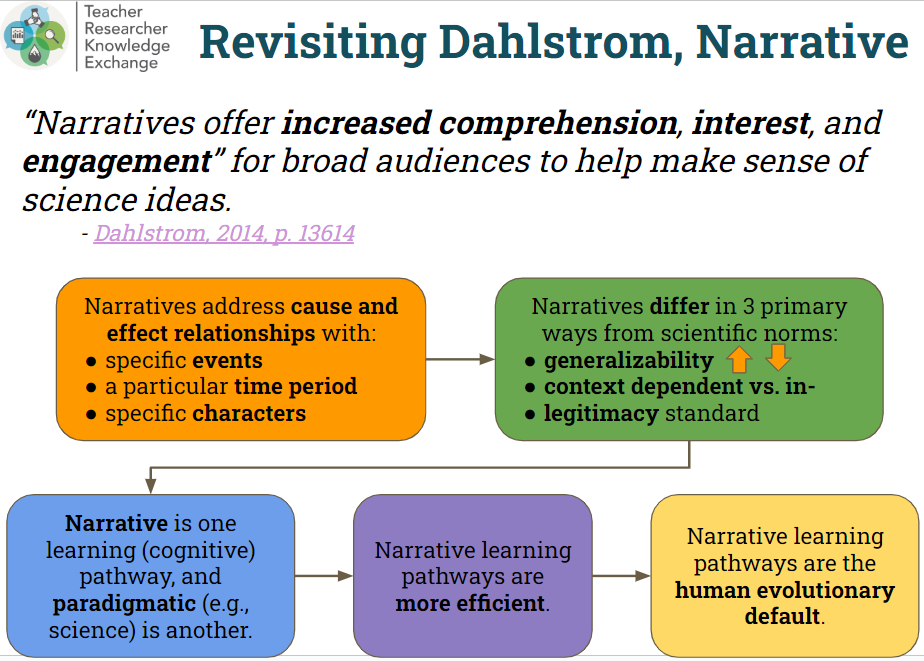
Mary synthesized ideas from Dahlstrom (2014), Howe (2002), Whyte (2018), and her own narrative practice to relay several key elements of effective, data-informed narratives:
- Use positive and accessible framing
- Provide access points to lived experiences and data
- Ground stories in cause and effect, connected to a specific event, place, and characters (human or non-human)
- Connect science to Indigenous and non-Indigenous memories, using place-based tools such as the Native-lands.ca map or Indigenous place names (Howe, 2002)
- Consider how relationships among people, communities, and ecosystems are shaped by society, inviting questions about ecological connectedness and fairness (Whyte, 2018)
- Use near-term future scenarios (e.g., the next decade or two)
- Incorporate multimedia elements (e.g., photos, videos, quotes, data visuals)
Modeling Narrative with Data
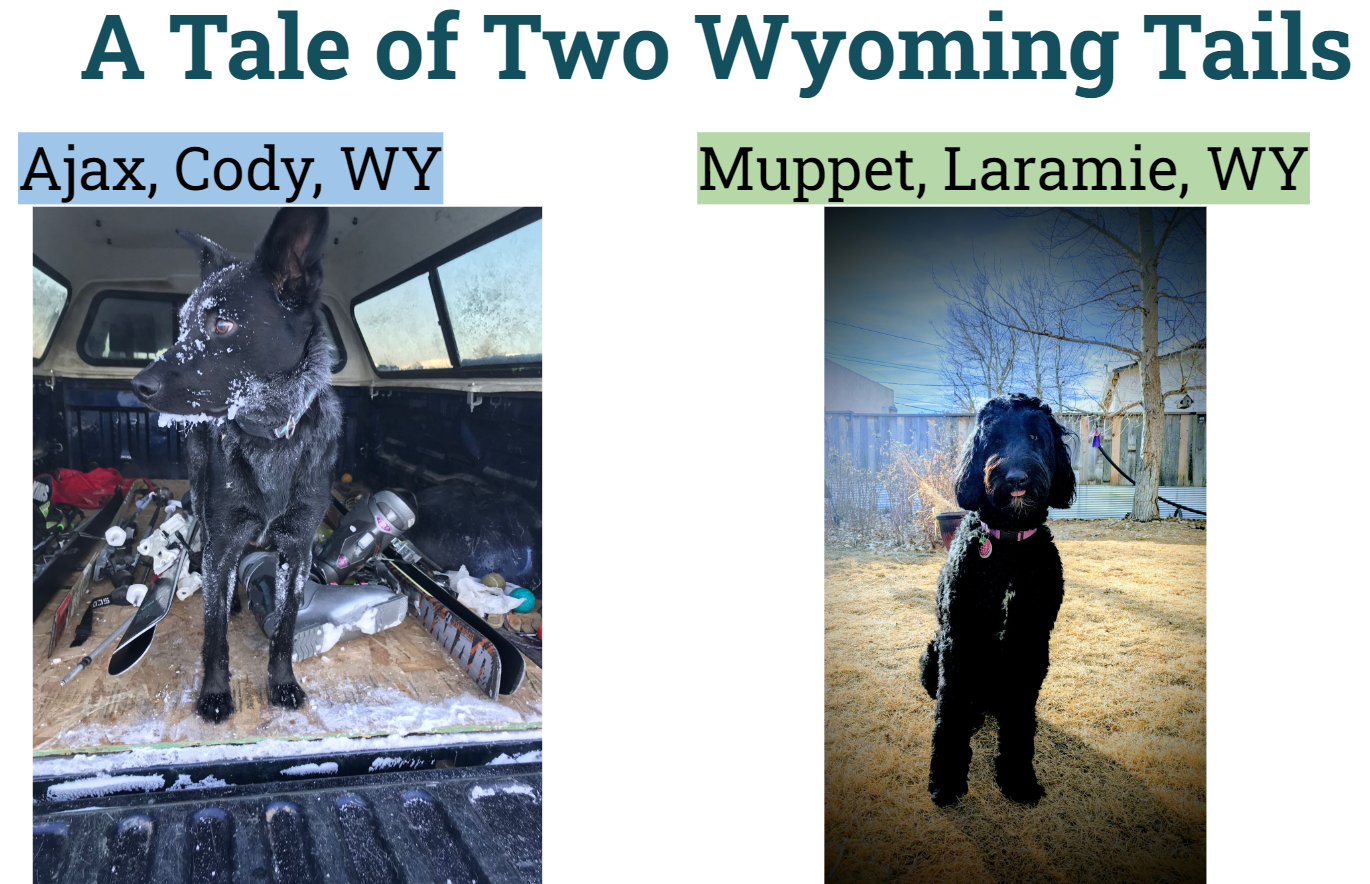
Our guest facilitator, Dr. Mary Keller, a Senior Lecturer for the Department of Philosophy and Religious Studies at the University of Wyoming, demonstrated how to bring narrative together with data from the WY-Adapt Climate Comparison Tool. The story follows two dogs, Ajax in Cody and Muppet in Laramie, as they scheme to get their people together for some winter skiing. Told from the dogs’ perspectives, the narrative uses humor and familiar winter contexts to draw listeners into the story while gradually weaving in climate data.
Mary's Model Narrative: A Tale of Two Wyoming Tails
Ajax is Mary’s 9-year-old, super-fit dog, who lives in Cody, Wyoming. Ajax and Mary love to go skijoring together, and Ajax has convinced his friend Muppet, who lives in Laramie, Wyoming, that skijoring is what they should do with their people next holiday season in December 2026. Muppet, however, has some unfortunate news to share: despite it being winter, snow conditions in Happy Jack near Laramie are not looking good in December 2025. They wonder what this will mean for December 2026.
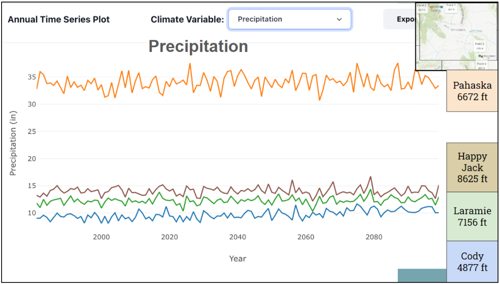
The two dogs begin planning ahead and decide they need to use some data to figure out where a winter meetup might actually work. They turn to the WY-Adapt Climate Comparison Tool to compare two possible skijoring locations near their homes: Pahaska near Cody, and Happy Jack near Laramie.

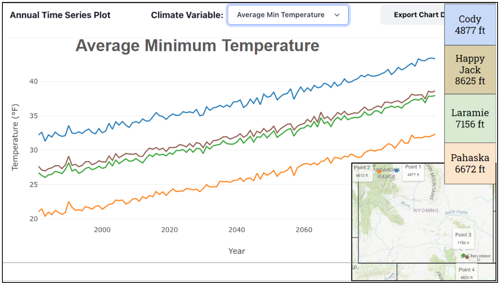
Elevation quickly becomes part of the conversation, as the dogs notice differences in altitude across the locations and begin to wonder how that might influence winter conditions.
Looking more closely at the data, the dogs explore average minimum temperatures projected into the future, thinking that colder weather probably means snow will “stick” and accumulate better. The model projections clearly show Pahaska is the coldest location, even though nearby Cody appears warmer than Laramie. This raises new questions, especially when Happy Jack, despite its higher elevation, appears slightly warmer than Laramie in the future projections.
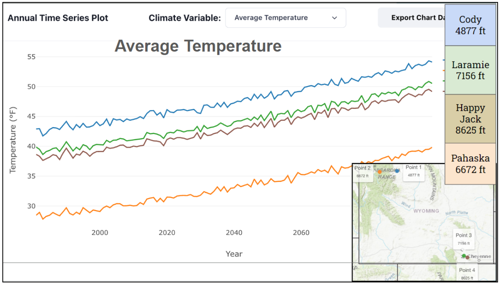
The dogs then examine average temperature model trends, which show a clear upward trend over time.
Next, they look at the precipitation model trends, which appear more variable and lack a strong trend line.
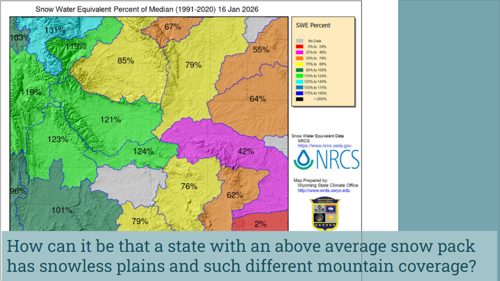
They then consider a current statewide snowpack data snapshot (from the Water Resources Data System) that shows above-average snow conditions across much of Wyoming. At first glance, the numbers look promising, but when they look closer, especially at southeastern Wyoming, they notice places with very low snow-water equivalent of 2% of the 1991-2020 median. How can there be above average in some places, and 2% in others? With such different experiences across the state, they wonder what winter might be like in different parts of the state in the future.
Ajax starts feeling bad for Muppet, realizing that while he may still be able to go skijoring near Cody during this 2025-2026 winter, Muppet might have a harder time down in Laramie.
Mary closed this narrative by posing the question, “What would you advise the pups to do for December 2026 if skijoring is the goal?” Participants needed to use the data, their experiences, and the characters’ priorities to grapple with uncertainty in making this climate-based prediction.
Crafting Narratives with Data
Following Mary’s example, participants worked in small groups to create their own narratives using a) data from the WY-Adapt Climate Comparison Tool, b) the narrative elements outlined above, and c) an outdoor recreation context.
The groups came up with stories that centered around rafters, otters, aspen trees, and more, making sense of the ways they might interact with the outdoors in the near future. Check out what they came up with HERE!
References
Dahlstrom, M. F. (2014). Using narratives and storytelling to communicate science with nonexpert audiences. Proceedings of the National Academy of Sciences - PNAS, 111(Supplement 4), 13614–13620. https://doi.org/10.1073/pnas.1320645111
Howe, Craig. (2002). Keep your thoughts above the trees: Ideas on developing and presenting tribal histories. In N. Shoemaker (Eds.), Clearing a path: Theorizing the past in Native American studies (pp. 161-180). Routledge.
Whyte, K. (2018). Critical Investigations of Resilience: A Brief Introduction to Indigenous Environmental Studies & Sciences. Daedalus (Cambridge, Mass.), 147(2), 136–147. https://doi.org/10.1162/DAED_a_00497