Data Check-ins: We include a data-inspired check-in to start each of our TRKE virtual sessions. We aim for these check-ins to be useful for our cohort's shared learning, but also hope our framing and the resources we share might be useful to other folks. We encourage you to look through this data-inspired check-in, explore the resources we use, engage with our prompts, and consider whether you'd be able to adapt this progression for your own context. Check out an example, below, to see if it might be for you, and explore our other posts with the “data check-in” tag to see other examples we’ve used.
Facilitator Context: We designed this check-in to use a StoryMap. StoryMaps bring learning to life in classrooms by combining maps, multimedia, and storytelling. They help students explore subjects, build digital skills, and create interactive projects, making lessons engaging and memorable.
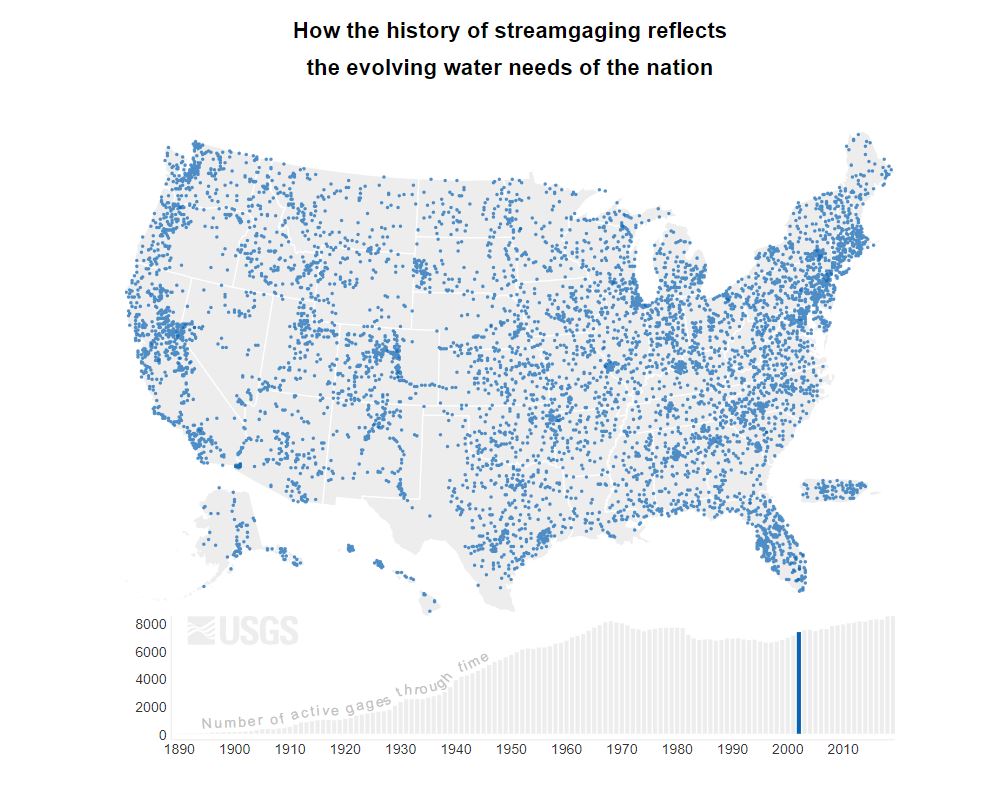
During our December 12th, 2024 Virtual Session we demonstrated a Data Check-in using the Gages Through the Ages StoryMap created by the U.S. Geological Survey (USGS). We used the following framing to engage teachers in the resource.
Framing & Flow: After opening the StoryMap, our participants were given time to explore trends in U.S. water monitoring over time and were given the following questions to help guide their exploration:
-
- "Investigate what the map at the top of the StoryMap tells us. What patterns or trends do you see?"
- "Scroll down to the map that shows gages by state. What patterns or trends do you see here?"
- "What connections do you see between these maps, and what questions do those connections raise for you?"
Following the exploration time, participants were asked to share their observations with the group.
A list of resources to help you get started with StoryMaps can be found here: TRKE StoryMap Resource List
A Data Check-in Skeleton: These are the general steps we include in all of our data check-ins.
- Identify a shared context and/or puzzling idea.
- Analyze/interpret a related dataset to explore trends, gather evidence, and test initial ideas.
- Reflect on what can be uncovered in these data and what new questions arise.
- Come together to share takeaways and connections to learners' own interests and contexts.
Reflect on How You Might Connect to these Ideas:
- How could you incorporate similar data exploration activities in your own context?
- What tools or ideas could help learners engage with real-world data?
- How might current research or researchers and interactive datasets enrich your teaching strategies?
