This activity enables participants to explore, analyze, and visualize climate model data alongside observed temperature data with user-friendly dashboards from WY-Adapt created by the Wyoming Anticipating the Climate-Water Transition (WyACT) team at the University of Wyoming. By comparing data from selected weather stations, participants can identify and discuss biases and uncertainties in climate models.
Model Bias: The Truth is Complicated
Model Bias: The Truth is Complicated
Explore Model Uncertainty with Climate Data from Wyoming
Tags: Uncertainty in Science K-12 Education Analyzing and Interpreting Data ClassroomLearning
Posted on April 05, 2025
Problem the Tool Solves
When we look at data from a weather station and predictions from a climate model, it’s easy to assume they should match. If they don’t, we might think something is off. But models and observations offer different perspectives—one captures a single location, while the other represents a broader area. In this activity, you’ll explore why those differences, called bias, are expected and what they reveal about uncertainty. Bias is the gap between a model’s approximation of the world and a specific observation, like your car’s temperature reading or the exact spot a bee stings your arm. That difference doesn’t mean something is wrong. Instead, it invites questions about whether we’re making the right comparison and whether the model is doing a good enough job at simulating the process that matters.
Who the Tool is For
This activity is designed for educators, students and anyone interested in climate science, data analysis, and understanding model biases.
Key Features
- Utilize user-friendly dashboards to retrieve climate data without the need for complex software installations
- Focus on area specific weather stations and time periods to analyze
- Visualize and analyze discrepancies between climate model outputs and observed data
- Engage in critical thinking about the reliability and application of climate models
How It Works
- Ask Participants: "What is bias?" and "How is bias related to uncertainty?"
- Set Up: Go to Annual Observed Global Historical Climatology Network (GHCNd) Dashboard
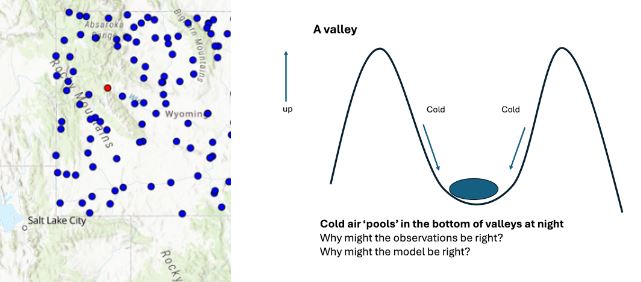
- Choose Location: On the right, you will see a picture of the state of Wyoming with a whole bunch of points where we have observations of weather over the past 50 years or so. Click on Elk Mountain, WY.
- Select Variable: Make sure ‘Variables’ is set to “Annual Average Temperature.”
- Analyze Data: Examine the period between 1990-2010, comparing observed data with the climate model predictions.
- Ask Participants: "Where modeled and observed data overlap, how do their trends compare?"
- Repeat for Another Location: Conduct the same analysis for Dubois, WY (steps 5 and 6). Offer the following context: "At the Dubois station at night, it gets really cold on the slopes of the mountains. This cold air gets heavy and sinks down the sides of the valleys, pooling at the observation station in a very concentrated way. This process is known as katabatic flow and creates a unique microclimate where that observation point happens to be located. Over time, even things like planting trees nearby can change wind, which affects the wind and temperature. As a result, the observation station no longer becomes representative of what's going on in a broader area.
- Interpreting the Differences: Reflect on the implications of differences between model predictions and observed data--can both be correct?
- Evaluating Model Reliability: Suppose we have to make the call on whether or not to trust our model's prediction or not. The weather station is different from the model. "What evidence or approaches could help you determine the model's reliability in this specific context?"
- Next Steps for Exploration: Since the model for the Dubois station was 3 degrees colder than the observed average temperature, the next step would be to bring in a second data set and compare multiple observations to better understand what's going on.
Application in Classrooms
- Introduce students to real-world data analysis
- Encourage critical thinking about the strengths and limitations of climate models
- Integrate STEM concepts through hands-on data exploration
- Support NGSS-Aligned investigations
For Additional Resources on Uncertainty in Science Check Out these Other Posts: