This activity helps participants investigate the range of climate model predictions for temperature and precipitation in Wyoming using dashboards from WY-Adapt created by the Wyoming Anticipating the Climate-Water Transition (WyACT) team at the University of Wyoming.. By comparing different global climate models (GCMs) and interpreting variability across datasets, learners build an understanding of relative uncertainty and model spread.
Relative Uncertainty: Exploring Climate Model Variation
Relative Uncertainty: Exploring Climate Model Variation
Analyze climate models across variables and timeframes using interactive dashboards
Tags: Uncertainty in Science K-12 Education Analyzing and Interpreting Data ClassroomLearning
Posted on April 05, 2025
Problem the Tool Solves
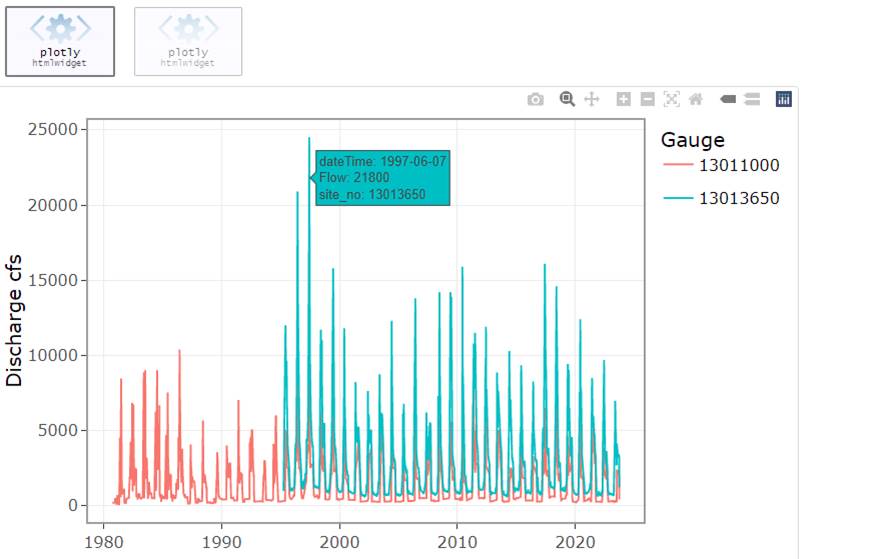
Climate models often produce different results for the same region, which can raise questions about which one to trust. These differences are known as model spread and don't mean a model is wrong. It becomes less "Is the model right or wrong?" and more "Are we making the right comparison?" Observations often come from just one point in space, while models cover much larger areas. This activity helps users explore that variation, compare multiple model outputs, and think about what differences between them actually mean.
Who the Tool is For
This activity is designed for students, educators, and anyone else interested in climate modeling, data analysis, and scientific uncertainty.
Key Features
- Select form multiple global climate models to explore variability in projected outcomes
- Switch between temperature and precipitation to see how model trends shift
- Identify points of agreement and divergence between model outputs
- Use targeted dashboard tools to analyze outliers and unusual patterns in the data
How It Works
- Set Up: Go to Annual Averages Dashboard
- Set Spatial Element: On the right pane, you should see "Select a spatial element," click on County.
- Select County: On the interactive map, let’s choose Sweetwater County, WY. Click it. A new time series will be generated.
- Choose Climate Variable: Under "Select a climate variable," choose Average Temperature.
- Select Global Climate Models (GCMs): In the GCM selector, choose cesm2, ukesm, and ec-earth3-veg. By default, you will see 30-year rolling-mean (30 yr avg) temperature curves.
- Rank: Rank the GCMs based on amount of warming.
- Change Climate Variable: Under "Select a climate variable," choose Precipitation.
- Compare: Compare warming trends with projected changes in precipitation.
- Add All GCMs: Add all available GCMs.
- Compare: Explore and discuss shared patterns and points of divergence for temperature and precipitation.
- Model Spread: Discuss model spread in both temperature and precipitation.
- Ask Students: "Which one of these models should we potentially consider dropping and why?"
- Analyze Annual Extremes: Go to Annual Extremes Dashboard, and change "Select a spatial element" to County. On the interactive map, select Sweetwater County for Max Consecutive Days Precipitation < 1 mm/day. Make sure the 30-year average is toggled on at the bottom of the Time Series graph.
- Analyze Annual Differences: Open the Annual Differences Dashboard in a new tab or window. Change "Select a spatial element" to County. On the interactive map, select Sweetwater County and Precipitation under "Select a climate variable."
- Compare: Compare the results from the Annual Extremes and Annual Differences. "What is happening between the two models? What are they telling us?"
Application in Classrooms
- Develop familiarity with datasets and representations
- Facilitate conversations around what it means for scientific models to disagree
- Use model variation as a platform for making and supporting claims
- Supports NGSS-Aligned investigations
For Additional Resources on Uncertainty in Science Check Out these Other Posts:
Related Posts
Model Bias: The Truth is Complicated
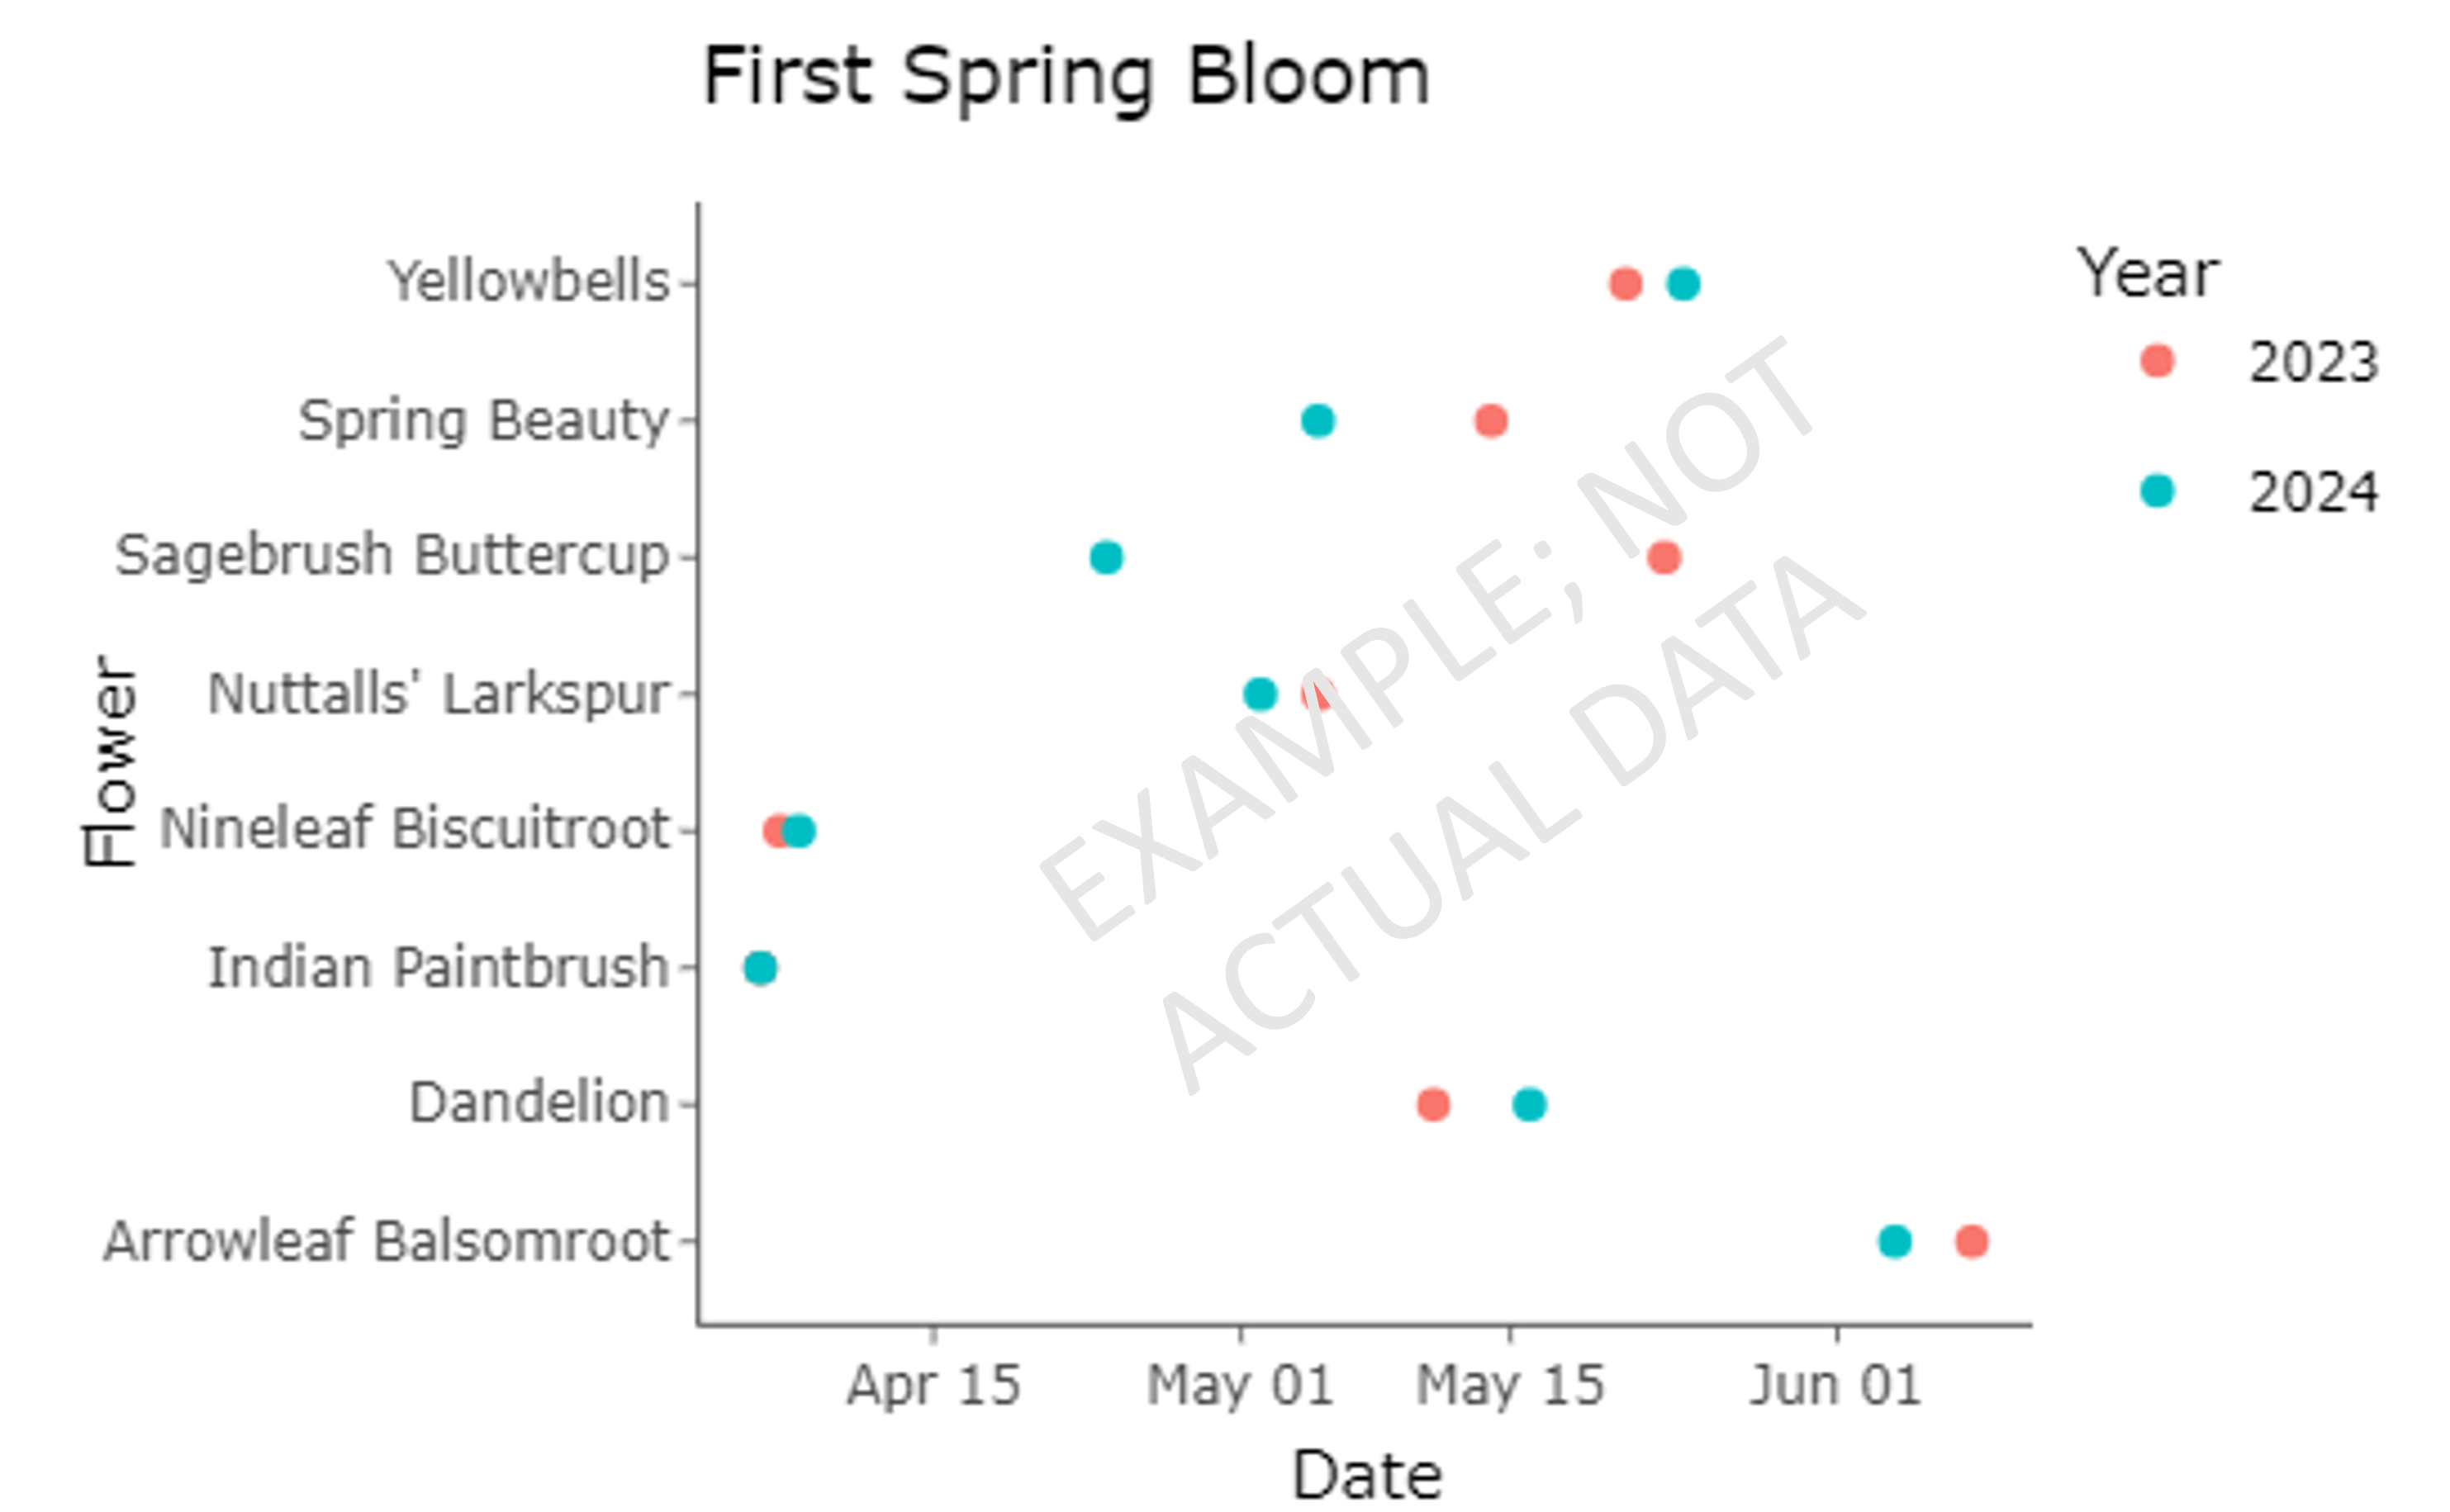
Wildflower Bloom Watch