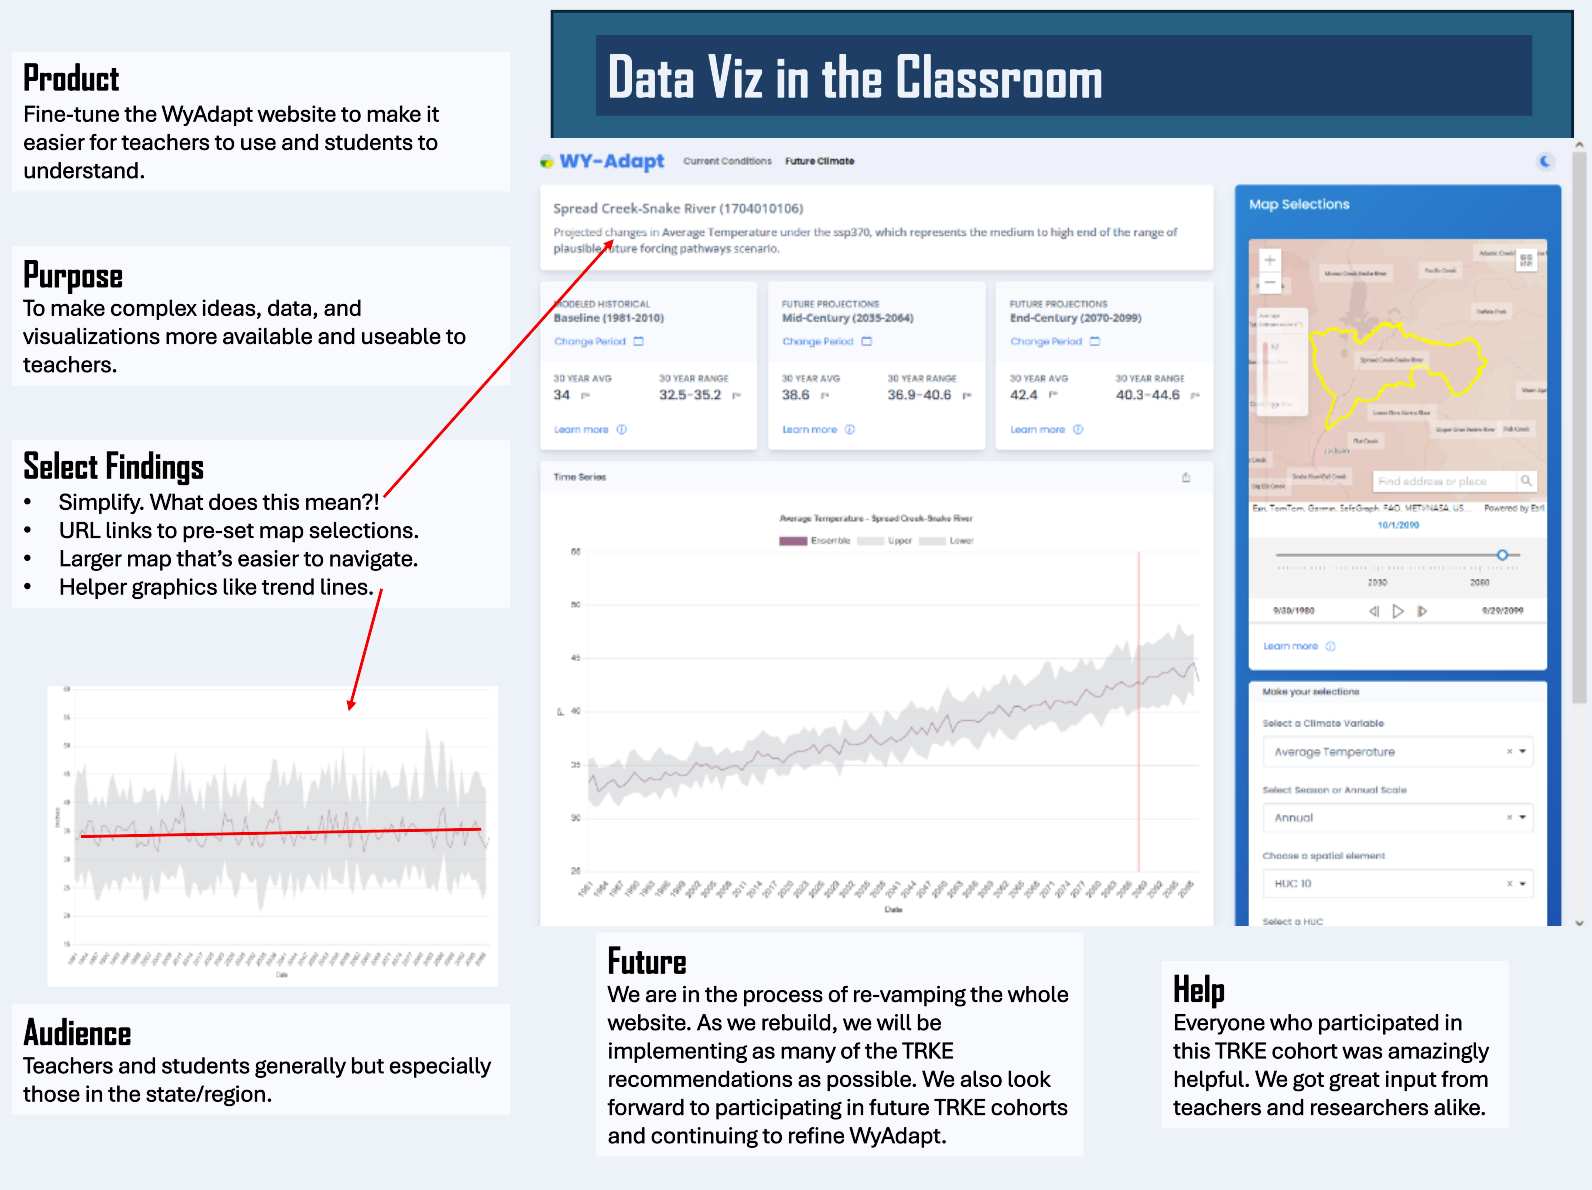
Luke Todd's presentation, titled "Data Visualization in the Classroom," focuses on using data visualization tools to enhance student engagement and understanding, particularly in the context of climate and water education. Using the WY-Adapt program as an example, he explores how data visualization can make complex scientific data more accessible to K-12 students.
Data Visualization as a Teaching Tool
Data visualization is an essential tool for helping students grasp complex scientific concepts. Luke’s approach is centered around integrating visual tools into classroom lessons, allowing students to see and interact with data in ways that foster deeper understanding. Visual tools help transform raw data into compelling narratives that are more engaging for students, especially when studying topics like climate change and water systems.
Using WY-Adapt as an Educational Example
WY-Adapt, a Wyoming-based educational initiative that focuses on the relationship between climate and water systems, serves as a practical example in Luke's presentation. By using the data from WY-Adapt, students can visualize how changes in climate impact water resources, precipitation patterns, and local ecosystems. The interactive maps and data sets within WY-Adapt allow students to explore real-world data and apply it to their own studies.
Goal: Improving WY-Adapt through Classroom Feedback
One of Luke’s primary goals is to use feedback from classroom experiences to improve the WY-Adapt program. By observing how students interact with data visualizations and gathering their insights, the program can be refined to better meet the needs of both educators and students. This iterative process of feedback and improvement ensures that the educational tools remain relevant and effective.
Key Takeaways for Educators
Luke emphasizes the importance of providing students with tools that help them visualize and interpret data, rather than just presenting them with numbers. By using tools like WY-Adapt, educators can help students build critical thinking skills and foster a deeper understanding of environmental science. Data visualization helps students see the connections between local climate data and larger global trends.
Conclusion
Data visualization has the potential to revolutionize the way students learn about climate, water systems, and environmental science. Luke Todd’s use of WY-Adapt in the classroom demonstrates how interactive visual tools can engage students, making complex data more relatable and impactful. By continuously refining these tools based on classroom feedback, educators can provide students with a more effective and engaging learning experience.
Contact for More Information
For more information about data visualization in the classroom or to contribute feedback on WY-Adapt, please contact Luke Todd or the TRKE program coordinators.
