Introducing our new Interactive Data Visualization Tool designed specifically for educators involved in classroom research. This tool enables you to collect, analyze, and visualize student data in real-time, enhancing your ability to make informed decisions and improve learning outcomes.

Wildflower Bloom Watch
Plot Wildflower blooms at a glance using RStudio
Tags: RStudio Wildflower Blooms K-12 Education Analyzing and Interpreting Data Patterns Science and Engineering Practices ClassroomLearning
Posted on November 11, 2024
Problem the Tool Solves
Turning raw data into visual insights can be tricky. This tool streamlines that process, helping teachers engage students with meaningful data visualizations while introducing fundamental coding concepts using RStudio.
What the Tool Does
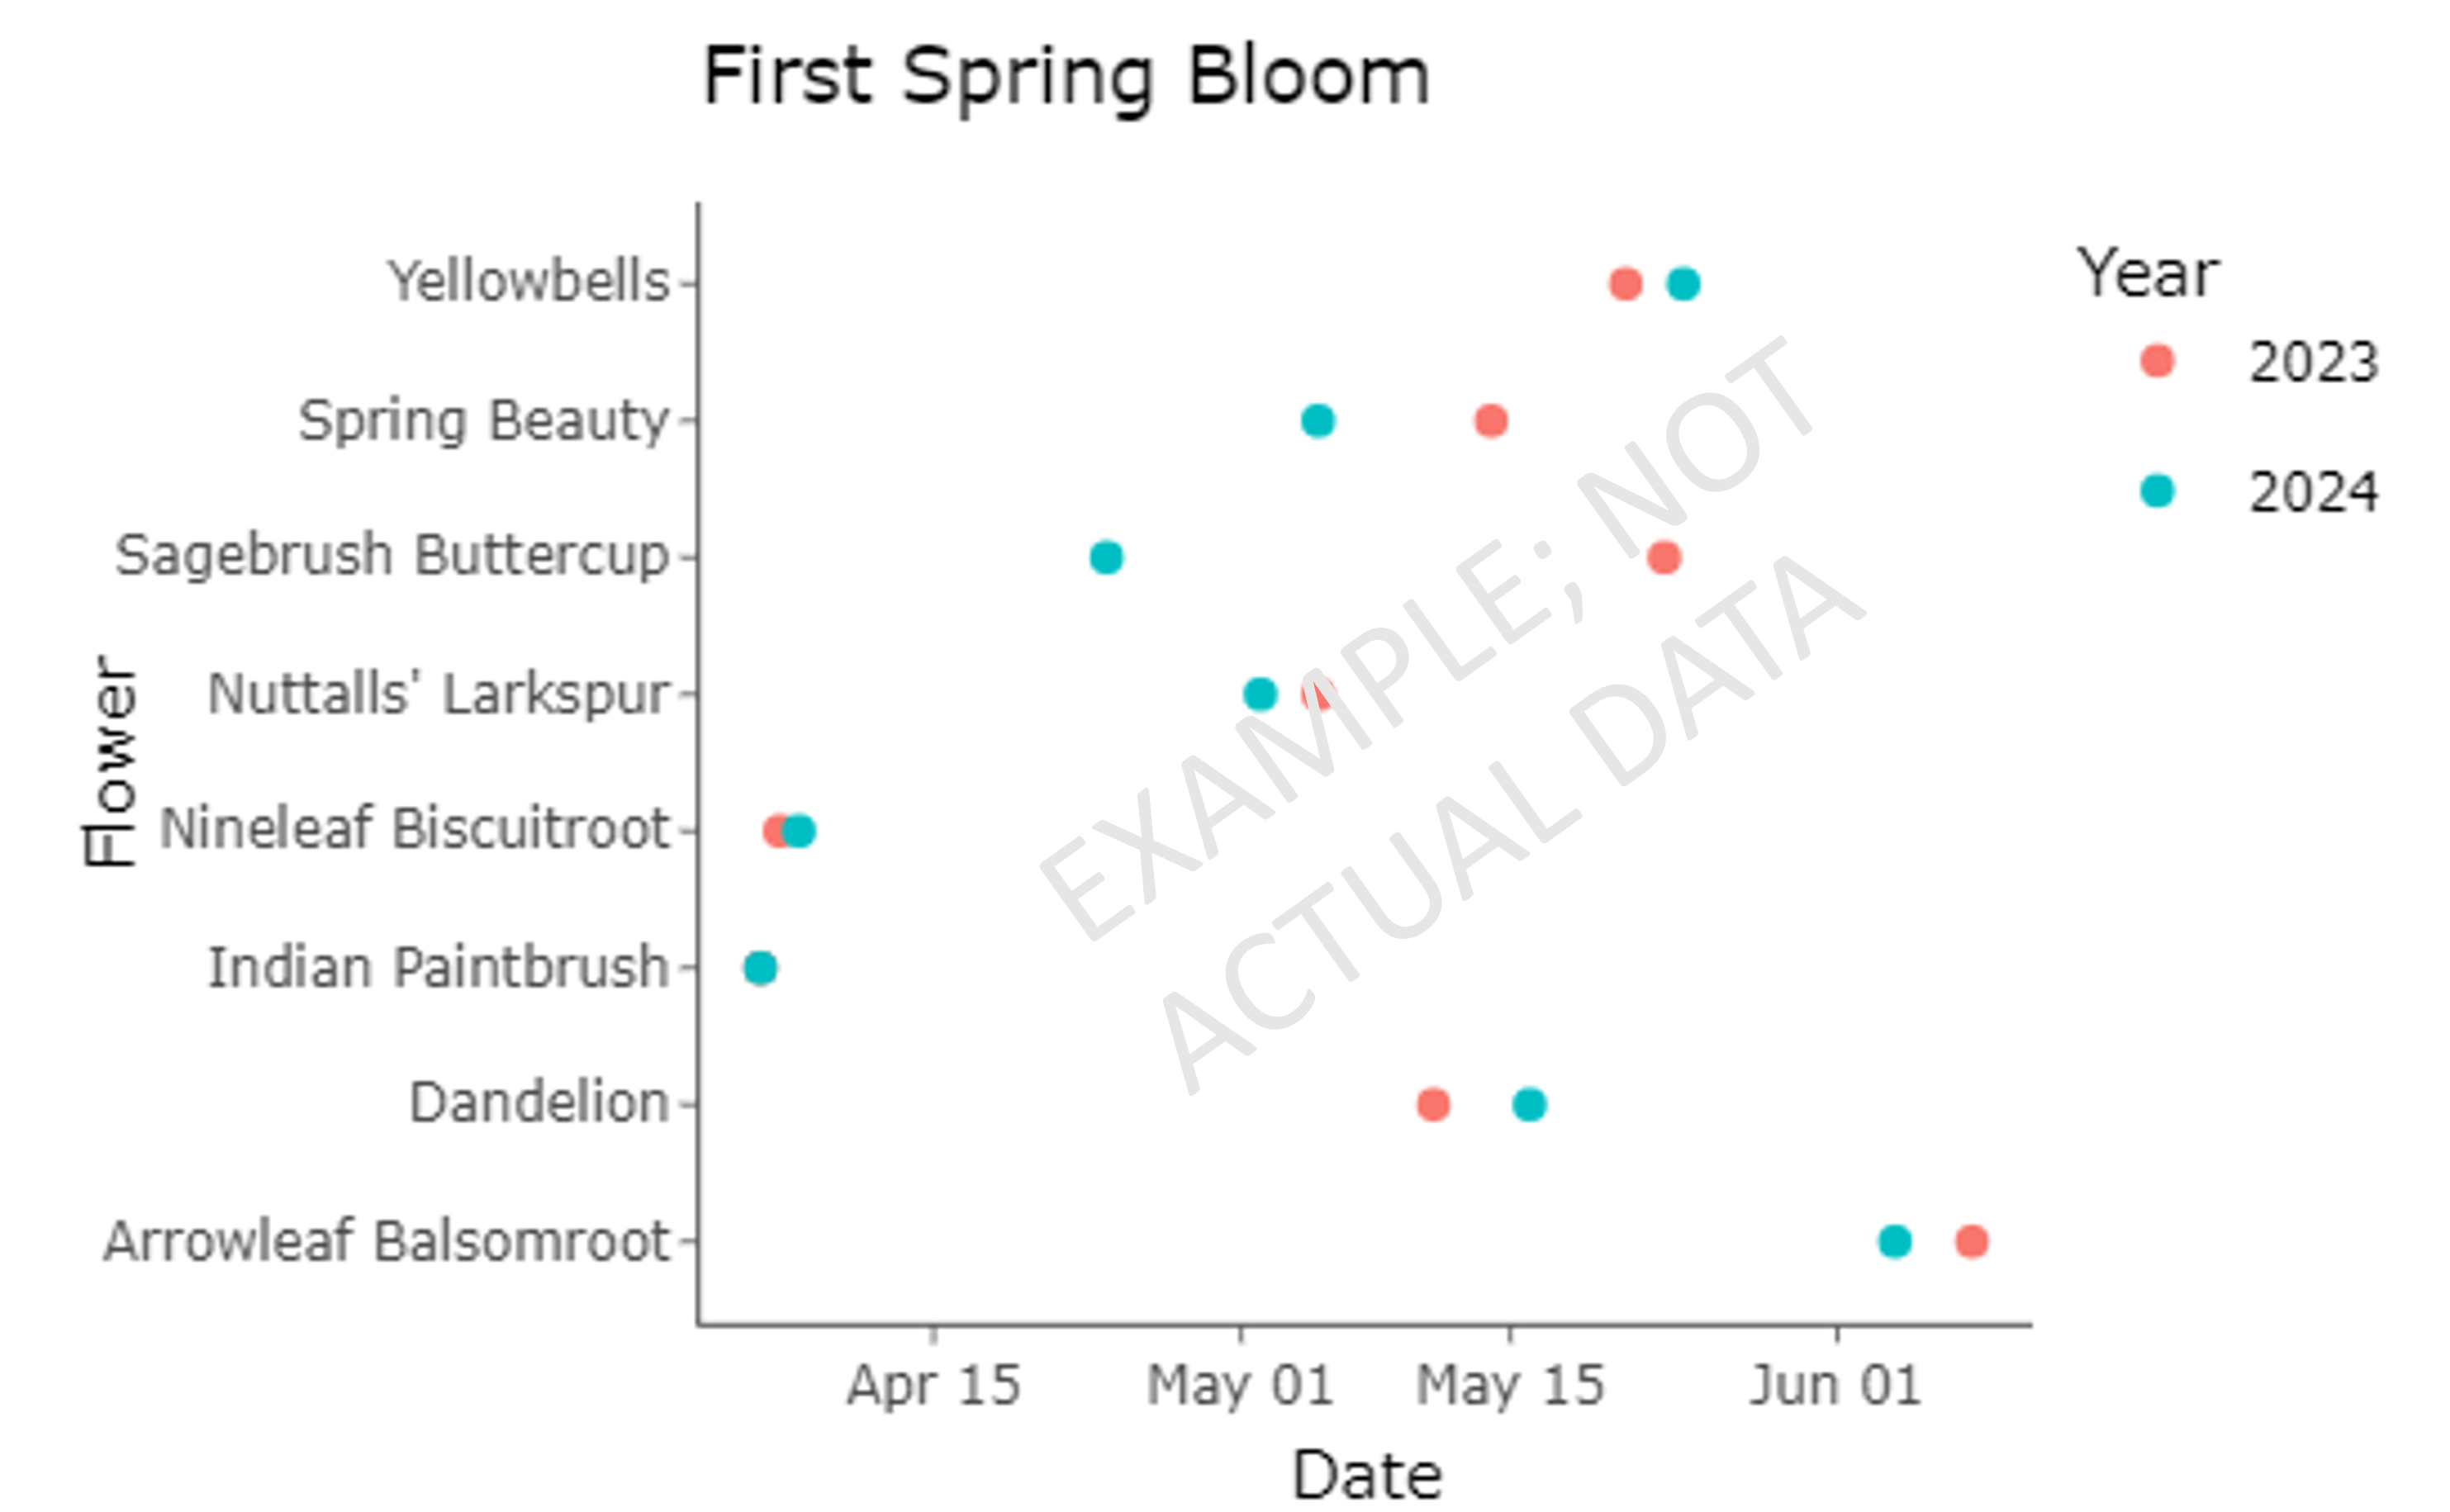
This tool allows users to visualize the bloom times of wildflowers they have tracked. By using RStudio and a simple R script, users can transform their collected data into easy to read plots, bringing environmental data science to life in the classroom.
Who the Tool is For
This tool is ideal for teachers engaged in research projects, data-driven instruction, or those collaborating with researchers through the TRKE program.
Key Features
- No prior coding experience needed. Pre-written scripts and an Excel template are provided.
- Transforms collected wildflower bloom data into visual plots, making data analysis easily accessible.
- Hands-on introduction to coding and data science.
- Supports analyzing & interpreting data and crosscutting concepts of patterns under NGSS Dimensions
How It Works
- Install R and RStudio
- Prepare your files using provided script and Excel template
- Open and run the script in RStudio
- Install & load packages in RStudio
- Create your bloom plot
Application in Classrooms
- Phenology Projects
- Citizen Science Data Plotting
- Data Science & Coding
- NGSS-Aligned Investigations
- Seasonal & Climate Studies

